Does the U.S. Government Debt Fit in a Bucket?
By Dr. Pierre Canac —Nobody will disagree that $12.8tn is a large and potentially scary number! That is the U.S. Gross Federal Debt held by the public at the end of 2014. However, if you divide this number by the U.S. Gross Domestic Product which is $17.7tn, we get about 73%. Is this a large number? Perhaps not! The general government gross debt for Japan is about 240% of its GDP, which is a lot higher than the U.S. Following WWII the U.S. gross federal debt was close to 110%. The key question to ask is not whether those debt levels are large but whether they are sustainable. This blog addresses the sustainability issue.
Interest rates on public debt: A measure of default risk
The yield on the 10-year U.S. government bond was 1.90% on 4/16/2015 while the yield on 10-year Japanese government bond was around 0.4%. These are nominal (not adjusted for inflation) yields and are clearly very low indicating that bond buyers consider these bonds to be extremely safe in spite of the significant amount of borrowing by these two governments.
The Debt in the Bucket: A visual model of debt’s growth or shrinkage
No, this is not the title of one of Dr. Seuss’ book! This illustration is designed to show clearly the two factors that determine the size of the public debt, first the primary budget deficit which excludes the interest on the public debt and is illustrated by the upper water faucet, and second the difference between the rate of growth of the economy and the government’s borrowing cost which is illustrated by the outflow from the drain valve.
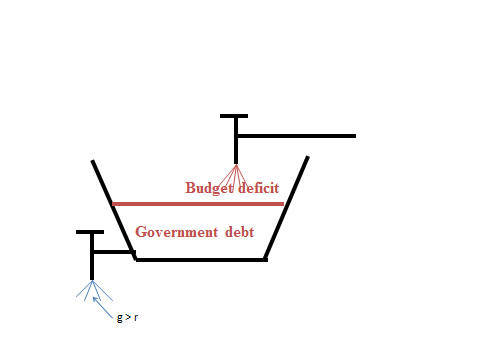
The public debt is represented by the amount of water in the bucket. The stock of debt in the bucket will increase if the inflow from the faucet above the bucket is larger than the outflow from the drain valve. The stock of debt will fall if it is the reverse or the outflow from the drain valve is greater than the inflow from the upper faucet. In order to clearly understand under what conditions the public debt of a country is likely to be sustainable one can begin by expressing the above model in terms of the basic math of the debt’s changes over time.
The basic math of the debt
Using basic algebra, I derive this equation in my classes:
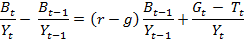
The term on the left hand side measures the increases in the debt (B) from last year (t-1) to this year (t) as a fraction of GDP (Y). This additional debt must be financed by issuing bonds. Therefore this term also measures the additional bonds issued by the government. This is represented by the increase in the amount of water (debt) in the bucket.
The second term on the right hand side of the equation measures the primary budget deficit, as a fraction of GDP. Gt measures Government expenditures this year (t) excluding the interest payment on the debt. Tt measures the net taxes collected by the government this year (t); it is obtained by subtracting transfer payments (unemployment insurance, food stamps and so on) from taxes. Thus the primary budget deficit excludes the interest payment on the debt (which is included in the first term on the right hand side of the equation). This term is represented by the flow of water into the bucket from the upper faucet. Assuming that the bucket is not leaking or the drain valve is closed, the stock of debt, i.e., the water in the bucket will increase if the government is running a primary budget deficit (Gt > Tt).
The first term on the right hand side of the equation is the most interesting. Its numerator is the product of r-g times the stock of debt accumulated over the years on which the government must pay interest. The term r is the real interest rate (nominal interest rate minus expected inflation) paid by the government while g is the rate of growth of real (inflation adjusted) GDP. If g > r and the primary budget is balanced (Gt = Tt), the debt will fall. In terms of my drawing, the drain valve is open and the faucet closed, so the water is flowing out of the bucket. Clearly if g is significantly higher than r, it is possible for the debt as a fraction of GDP to fall even if a country has a primary budget deficit. In other words, a country with a small deficit can grow so fast that its debt burden expressed as a percent of GDP falls. This is quite important to understand because it demonstrates that a country does not have to run a primary budget surplus in order to experience a reduction in its debt. This is pretty much what happened to the U.S. and the U.K. after WWII. The U.S. government debt declined from 110% of GDP in 1946 to 22% of GDP in 1974 while the U.K. debt fell from 240% of GDP to less than 50% over the same period. In both countries the debt reduction was progressive and happened slowly and without any significant interruption in spite of the mild recessions (five in the U.S.) encountered along the way. This was possible because, following WWII and until the first oil shock, the rate of growth of real GDP (g) was much higher than the real interest rate (r) paid by the government.
Should we be concerned about future debt in an era of low growth and low interest rates?
Today the economy is not growing as fast as in the 50s and 60s, but real interest rates are very low and have in fact been steadily declining since the mid-1980s. Thus we still are in a situation where the growth of the economy (g) is higher than the real interest rate (r). Under these conditions, one can expect the US debt to GDP ratio to decline somewhat or to stabilize around its current level of about 70% as long as the primary budget deficit does not become too large and the rate of growth of the economy remains higher than the real interest rate. Given that the actual budget deficit, including interest payments, went from about 10% of GDP in 2009/10 to 2.5% in 2014, one can be optimistic that the U.S. government debt is sustainable and thus should not be a cause for concern. Oh and did I mention that unlike us humans, the U.S. government will never die and thus can rollover its debt indefinitely so that it never has to repay it?
In the case of the Japanese government, it will take significantly more effort to reduce its debt below 240% as Japan has experienced low growth for more than two decades. However, the Japanese government debt is entirely held by the Japanese people and not by foreigners, so all of the tax dollars the government collects to pay interest simply recycle to the Japanese people. This happens because the Japanese households have such a high savings rate that their savings are sufficient to buy all the bonds issued by their government, with extra funds to purchase US debt as well. Indeed, they are now the largest of all foreign holders of U.S. Treasury bonds ($1.224tn). Thus the Japanese government debt, although huge, is sustainable. Concrete evidence in this is found in the fact that investors are willing to buy these bonds even at very low interest rates.
However the situation is very different in Greece. The Greek public debt is about 175% of GDP, a level which is clearly unsustainable even though the Greek government has a primary budget surplus. Their bucket is filling up as the interest on the debt (r) is so much higher than the rate of growth of their economy (g) that the first term on the right hand side of the above equation is not only positive but is not offset by the primary budget surplus of the government. Thus the debt of the Greek government is still increasing and it is likely that a default will be hard to avoid.
Could there be a shortage of government bonds?
Outside of Greece, there is already a shortage of such bonds in the Eurozone countries. This suggests that there is too little debt rather than too much. The high demand for bonds has caused interest rates to be negative in many European countries inside and outside the Eurozone. Although U.S. interest rates are not negative, they are fairly low by historical standards. There is a huge demand for safe assets and obviously the safest of all assets are U.S. Treasury bonds. This is so because the U.S. cannot default on its debt since the debt of the U.S. government is denominated in U.S. dollars, including the debt owed to foreigners. Thus the U.S. government could potentially eliminate its entire debt by printing about $12tn of paper money and handing over the dollars to the Japanese, Chinese, Americans and other U.S. debt holders. Yes, this would cause inflation, but the U.S. could deal with this problem afterwards. The point is that the U.S. government cannot default on its debt, unlike the Greek government, as the U.S. borrows in its own currency while the Greek government must issue bonds in euros which it does not control and cannot print.
Finance models without risk free Treasury bonds? Maybe we need them!
Imagine for a minute that the U.S. federal government were to eradicate its debt from one day to the next. What would U.S. investors in search of risk free assets be forced to do? Buy foreign governments bonds? They are not risk free, since they bear some exchange rate risk. Buy corporate bonds? They are not risk free either since a corporation could go bankrupt, thus ending its theoretically unlimited life. A further problem is that without risk free assets, how do you price other securities that are risky since their rate of return is equal to a risk premium over the risk free rate? The market simply could not price the numerous securities that make up a well-diversified, although not riskless, portfolio. To accomplish this, the field of finance would have to be reinvented. In short, it just would not work, either in theory or in practice.
Pierre Canac, Ph.D.
Associate Professor of Economics